
One of the main challenges to solve within quantitative research is data management. Historically, data has been an inaccessible resource, expensive and only available to large institutions. Over time, all these barriers have been overcome, democratizing access for all users, eliminating its main barrier to entry (high costs) and bringing prices down to a few anecdotal dollars.
In my professional experience, I have been able to work with different architectures dedicated to storing, capturing, sorting, and processing data. And I have always reached the limit of the architecture, with problems to keep advancing.
These architectures seem designed to fulfill specific functionalities, not to be resilient in the future. They are solutions that serve to "get by", but not to create databases with a long-term perspective.
In 2023, after the brutal technological leap that society has experienced, Big Data-based technologies are affordable, easily implementable, robust, and secure. And the use of classic databases (SQL) on financial data has become outdated, replaced by more modern solutions that also provide the great advantages of NoSQL databases.
Vocabulary
First, we explain the basic concepts needed to understand the value of using one technology over another.
Datalake
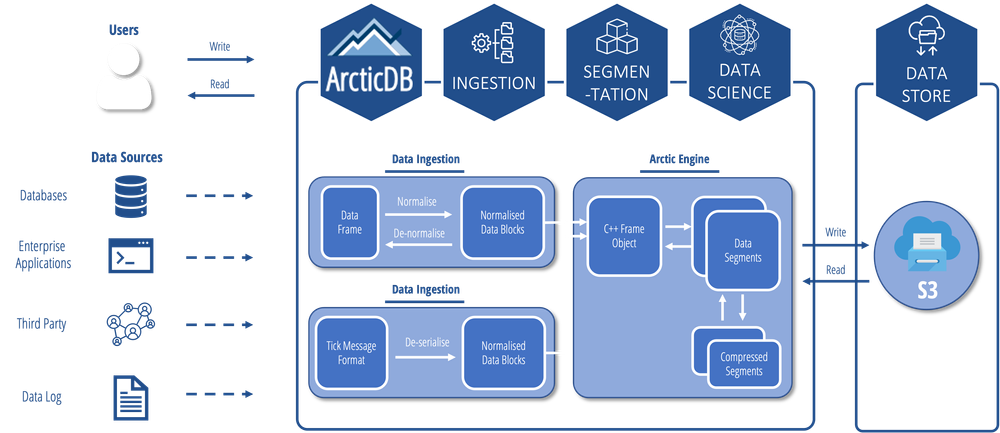
A datalake is a storage object that can be local but is usually deployed in the cloud, following a structure of dumping information into a single NoSQL point. Through centralization, it facilitates maintenance and administration tasks.
A visual example could be this image. Where all data input sources are dumped into a datalake, while clients query the datalake for the information they need.

Data Management
Data Management is the discipline that manages everything related to data management. Within the world of quantitative trading research, we must create the solutions that best adapt to a professional research environment. When we refer to Data Management, we mean everything from selecting the service provider to integrating with the development model using the managed data.
Big Data
Any data architecture that meets the following characteristics:
- Velocity: That it is possible to create, access, store, and process information in an agile way.
- Variety: That all types of information can be stored. That schemas are flexible, and there are no restrictions on the information stored.
- Volume: Designed to work with massive amounts of data. Ready to process a lot of information very quickly and of all types.
Object Store (S3)
Being extremely simplistic, we could define it as a giant hard drive in the cloud, which we can use as storage at any time, simply by authenticating with a username and password.
The disks are in Amazon's data centers distributed around the world; we simply choose a location and a read/write speed technology (the faster, the more expensive, obviously) and forget about the rest.
This provides the perfect architecture for developing cloud-native applications, since operations run on the "client-side" while storage is at a secure Amazon location. Getting the best of both worlds.
Amazon AWS EC2
Amazon Web Services EC2 is a "System as a Service" service. We select a power capacity, a hard drive, and an operating system, and run a virtual machine in Amazon's data centers in a matter of seconds. Its pricing is per minute, and it can host everything from small personal projects of no value to the most complex infrastructures of the most valuable tech companies. It also has an assistant for novice users called Amazon Lightsail, which facilitates the entire process at a chimpanzee level (a level where anyone could launch the service).
I recommend researching Amazon Web Services, since it is one of our sponsors, and we will use their services whenever possible. It also offers other alternatives in case anyone wants to research other providers.
Differences between SQL and NoSQL
SQL databases are relational, and NoSQL databases use different linking methods such as graphs or key-value. This allows greater flexibility by not depending on a rigid schema like traditional SQL databases. In addition to the ease of scaling, causing a low percentage of temporal inconsistency.
SQL is appropriate for projects that prioritize consistency and integrity, while NoSQL databases prioritize scalability and big data values. They can be inconsistent at certain points until the entire process finishes. (A problem we will solve satisfactorily using ArcticDB)
Data

A research process, through information processing capacity, must formulate a valid hypothesis that describes new competitive advantages for extracting value from the market (alpha). To explore the entire market spectrum, there is only one source of certainty: data.
Data is facts. They are information shared by participants in the asset about relevant events that occur. The most basic simplification made in finance is to evaluate, within a time frame, the open, high, low, and close, and volume. But the amount of information an asset generates during its life cycle is much more extensive than simple price information.
Within Big Data, we can classify all data into three major groups:
- Data: The information itself. The captured data
- No Data: Data when there is no data.
- Metadata: Data generated about the data.
To better understand this concept, let's give an example. We are capturing the data emitted by our own mobile phone. Our requirement is the amount of data sent per second, regardless of anything else; our only quantitative criterion is the amount of information sent.
Data is characterized by being information interpretable by all its users. It does not lead to ambiguities. In our example, it would be the amount of data sent per hour.
Non-data is the data provided when there is no data. Many of you may be wondering right now: but if there is no data, what do I care about the data?
Well, they are fundamental. For example, following our example, non-data would be exactly that the data sent per hour equals 0. Having no information, we would store as non-data the time periods where no data existed, and other data such as the active metadata at that moment.
And now we come to metadata. It is information that contextualizes the data, information that when removed does not alter the data, but when added provides vital information.
Following the example, metadata could be the phone's location, the last signal level received, or any other variable being generated at that moment.
Many companies have spent enormous amounts of money to collect and store as much metadata as possible, without being very clear about the use they would give it, and now they are starting to include it in machine learning models.
Although this is just the beginning, they already form a very necessary part of any data research.
So, with all this information we could induce much more information. That is, combining the data, i.e., the number of packets sent per hour, with the non-data, which is the data of when there is no data, and the metadata.
We generate unknown additional knowledge, which gives us clues about where the solution is, but cannot be concluded irrefutably, rather it acquires certain statistical significance a posteriori (and I don't mean 30 cases).
For example, we could deduce that:
- During hours of highest activity -> They are free
- During hours of lowest activity -> They are working
- During night hours -> It's their home
- During day hours -> It's their workplace
- During weekend hours -> It's their home
- Etc...
Ultimately, by combining the three basic sources of information, we infer new data, we conclude with new information, which in many cases will be real, and in others not, because for example, anyone who works only weekends and from home, the model will not categorize correctly).
But models are not oracles ready to give a personalized solution for each case; they are models that try to adapt to a general trend of society (and consequently, the importance of nowcasting, to understand at what exact moment the model has lost its statistical validity).
The same happens in finance; for example, in a portfolio of n assets, the variables that could condition tomorrow's return of that portfolio could be almost infinite, but certain mechanisms have been established through observation and information induction, by which using the combination of different information sources, we can generate new information through induction, not previously known.
We are talking about something as simple as the impact of an event on a company's price, or how when the general trend of a sector is to gain momentum, all companies in the sector, regardless of their internal state, perform better than when such momentum does not exist.
And hence the importance of data. Within the quantitative world, within the Alpha discovery process, data is everything.
And with low-quality data, the most likely outcome will be low-quality research.
The raw materials in quantitative research are basically two.
- Information processing capacity: Houses all the necessary infrastructure to carry out the quantitative processes that determine the solutions to our questions. We are talking about physical resources. CPU, RAM, HD, GPU, TPU...
- The data itself. Information is power. Besides being the main source of information input. And when we talk about data, we don't just mean price. We talk about asset metadata, fundamental data, news, etc., in addition to a new class of data that is becoming standardized lately, known as alternative data. These are totally exogenous data, but with very deterministic components and great impact on the study object. Such as an analysis of a social network, an analysis of supplier or customer capabilities, or any other relevant information.
Requirements

There are infinite solutions for storing time series. But since this solution should endure over time, with the ability to adapt to all unforeseen changes the future may hold, our datalake must meet certain requirements to ensure this technology will be optimal, both today and in the future.
The initial requirements are:
- pd.DataFrames(): The use of pandas DataFrames both for input and output is essential.
- No servers needed: That it can be directly deployed on a cloud object structure, maintaining very strict speed, security, and stability requirements.
- Unstructured: Assuming the future is uncertain, and at any time the amount of information available for collection on the same asset may increase. Classic fixed structures are totally obsolete for this purpose.
- Snapshots and versions: That they can access different versions of the same symbol, or of the entire database via Snap.
- Metadata: Metadata management is paramount. It must have the ability to add metadata about any symbol or database.
- Backed: That it is a technology with institutional funding, or directly a hedge fund or relevant institution involved in its development.
After testing many architectures, I ended up finding the best solution for me. I even got to create transcoders from pd.DataFrame to direct binary data. But the remedy was worse than the disease...
ArcticDB
The first time I had contact with ArcticDB was at a PyQuant event in 2017, where some guys unknown at the time had set up a MongoDB architecture to store data. At the time, it was a great revolution given its pd.DataFrame in, pd.DataFrame out mechanism. Facilitating all kinds of tasks enormously, in addition to universal integration in all research fields, since pandas and numpy monopolize the worldwide data-science spectrum.

But being such a new project, with so many critical parts within the architecture, I investigated it thoroughly, and abandoned it, with the hope of returning later to see a mature and usable project.
By using an intermediate server like MongoDB, it was more prone to catastrophic errors (compared to the solution used), which I was not willing to assume at that time.
ArcticDB comes from MAN Group, an entity with a long track record in applying quantitative models to financial markets.
So I knew that unless there was a technological leap to a superior technology, the idea the ArcticDB guys had was brilliant, and it wouldn't cost them much to find funding.
And so it happened, a few years later and after signing an agreement with Bloomberg they have created a C++ engine, which has total integration through Python libraries.
Taking any project based on pd.DataFrame toward a true big data scale architecture (Petabyte-Scale). It provided processing capabilities over extremely large data groups, with great competence.
And what have they achieved with this?

Basically, creating a datalake system capable of processing billions of rows in seconds, or what is called Petabyte Scale, in a way that integrates into the pipeline of any Python researcher, through its pd.DataFrames in and pd.DataFrames out format, without the need for a server, since it is deployed directly on an S3-type object, and fully ready to implement in production in a real environment.
- It allows us to process billions of rows and columns per second
- It allows us to scale from a Notebook to a production Cluster with total stability and without performance losses
- It provides researchers with a datalake anywhere, since it is a cloud-native product, facilitating the processes of creating datasets and universes. Anywhere, in any environment, and under any circumstance.
- Bringing NoSQL to classic pd.DataFrames and all the advantages that entails for maintenance
- Without fixed schemas, and able to change the database structure at any time, without consequences
- Safe data modifications, thanks to versioning at the symbol level, or snapshots at the datalake level. Where each ticker is never deleted, but a new version is created. (Increasing the database size, but providing a way out for any error, and reducing critical points).
All these features facilitate access to technologies with computing power that, just 10 years ago, would have been unimaginable for a retail investor to deploy without institutional support.
Given its very high performance, it is a database suitable for use with high-frequency modeling and execution methods.
ArcticDB is fully prepared for tick streaming, from L1 and L2 and orderbook tickdata, capable of processing billions of rows and hundreds of columns in seconds
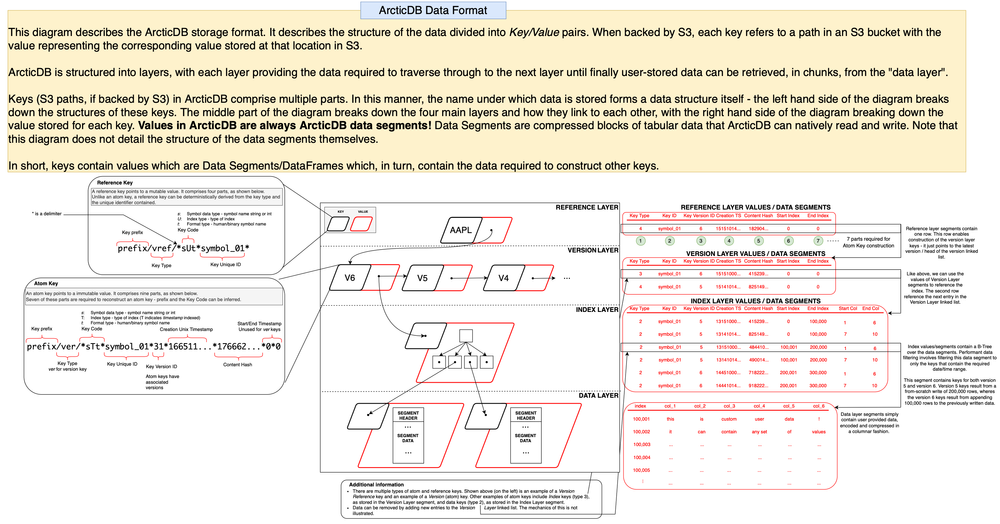
Once the main technology of the Datalake has been introduced, we will establish the minimum architecture needed to implement the project.
The goal of this deployment is not to create the fastest datalake on the market. Simply to generate an economical datalake (at the infrastructure level), easy to maintain, and with more than sufficient quality, speed, and stability for day-to-day research tasks, and still faster than the conventional architectures currently used.
Architecture Used
One of our main requirements is that the datalake be server-less. That is, it doesn't need any operating system to launch it. That it is designed to run in a cloud-native way.
Facilitating access for designated users via an API KEY to the customized datalake. The secret to not needing any metal to perform operations is that these operations are processed on the client, i.e., the Python kernel executing that instruction sends the exact query to S3, so that it returns the requested resources.
By using this type of technology we achieve:
- Greater scalability, since storage is infinite if necessary, and increases according to the needs of the moment.
- Greater stability: By eliminating the system itself from the equation, we minimize contingencies from an OS update error or any other external factor to the database.
- Greater speed: By being able to use high-speed storage on Amazon S3, we only need to ensure a connection fast enough to carry out data ingest tasks. Currently, I am achieving speeds of 6 gbps upload and 6.5 gbps download using Amazon S3 Storage at the Zaragoza datacenter (Remember to always choose the location closest to your country).
I use Amazon S3. But there are hobby-level alternatives that can perfectly meet the needs, all for less than 0.002€/gb/month
Data Requirements

In this technological revolution taking place in financial markets, data, non-data, and metadata are taking power.
Every alpha source discovered in the history of finance comes from a discovery in available information, and its subsequent exploitation.
As we said before, data is the main source of everything. And as if it were a culinary recipe, the higher the quality of the information, the better the model results.
The necessary data is very diverse depending on the asset; consequently, we need to be able to assign schemas to the information, but these should not be fixed. That database structures, through versioning, can mutate to new schemas (while also being able to roll back in case of contingencies).
The data we need is structured as follows:
- Precio: Data in OHCLV. The basic information since many critical functions that models depend on, such as calculating models based on value variation, like execution points. Data granularity depends on your needs, but being designed to withstand all types of loads and high-frequency processes, it supports any type of data you need to store.
- Metadata: Metadata is a fundamental part of my pipeline, since I use it to create asset universes. I will store all information I consider relevant and that does not change over time, such as an asset's currency, or a label obtained by some classification model... Any other invariable information will be considered metadata.
- Fundamental: Fundamental data is essential to have a datalake in proper conditions. Since it provides different company classification criteria, independent of price. Additionally, there are different types of information, besides their financial statements, their institutional holder tops, or their valuation withdrawals based on some trendy framework, currently ESG, among many others. Furthermore, we must consider that there will be unique data, and data with history; consequently, having a dynamic schema facilitates any setbacks that may arise in this aspect in the future.
- Alternative: In addition to all the explained data types, we also have alternative data to add to the datalake. When we talk about alternative data, we refer to data such as sentiment analysis of a social network, or news published in relevant media, or any other non-industry-standardized information that you consider may be relevant for any model.
- LOB Level: In many cases, we will need to work with Order books. There are two ways databrokers serve them: one is time-aggregated, and the other is a constant stream of changes in the book. These structures are very costly in terms of information per time interval, but widely used. Especially necessary for working with futures and spreads, and also highly recommended for working with options, given the usual spreads for crossing orders.
- Macro: Other information needed within our datalake will be macroeconomic information of countries, both national debt history and different basic macroeconomic ratios. All this information can be included later in models and studies, providing greater scope to research.
- Data Options
There are multiple alternatives to choose data brokers or data providers. In the past, there was a clear indicator of data quality, which was price. Expensive data always implied high quality in its treatment, manipulation, cleaning, and distribution.
But the increase in supply and technology has democratized the pricing of many providers, making it possible to obtain data from different sources.
For example, the only way to manage an investment fund in the 2000s was mandatorily through Bloomberg Terminal.
The most daring used Reuters (currently Eikon). Today, its use is more linked to technology integration with the company, than to the need for quality data.
Because despite having indisputable data quality, there are different solutions for much less than the annual price of a license for any of these platforms.
Additionally, for everyone starting in quantitative trading, they can also use some of the available free data sources.
Personally, before testing any model with real (quality) data, when I'm adjusting something in the model or the execution pipeline, I'm very inclined to use yahoo data through the yfinance library, basically because in 2 lines of code I have the data I need—a (bad) habit I should start correcting, since with the Datalake, it becomes totally absurd, as the platform we are creating will be much faster by definition.
I will name certain providers that, excluding the usual suspects of Bloomberg and Eikon, meet to some extent my basic requirements to be considered quality databrokers:
- Stocks: Nasdaq Data, Norgate Data, EODHD, IEX,
- Futures: Norgate Data, DataBento, Nasdaq Data, CME Data
- Bonds: GBONDs, FRED, EODHD
- Alternative: Nasdaq Data, EODHD,
- Crypto: EODHD, BINANCE, Coingecko
- Macro: JPM Synergic MACRO (which we will discuss at length in future occasions)
Ultimately, the decision to choose a data source is yours and yours alone. To develop the entire datalake using the premise that anyone can replicate it at home for a nominal price, I used EODHD and DataBento, and I am satisfied with the results relative to the price of data acquisition and the quality of the data obtained.
Coming Soon
Once the minimum functional characteristics of the project have been established and the need for its inclusion justified, in the next installments we will create a datalake from scratch. The goal is to create a stable and functional base as a proof of concept of the technology.
The datalake will be programmed in Python, using Amazon AWS EC2 technology and EODHD and DataBento data for futures.
We will generate a basic command and control structure, and an ingest process to dump our information into the datalake.
We will use different data sources, such as various APIs, CSVs, or data collected by ourselves (such as an orderbook of some cryptocurrency).
With all this, we will achieve a datalake ready to start research processes on data you probably didn't have access to, or rather, you never had everything centralized in a single point and in a format friendly to community customs, such as the intensive use of pandas and its pd.DataFrame().
Related posts: Big Data Management 3: Building a Datalake on the Nasdaq with ArcticDB · Big Data Management 4: Using the Datalake in Zipline.