
In this new installment of intraday seasonality, we are going to perform a field search. It consists of running the backtest we have previously programmed on different days, different hours, and different intervals within the operation, to map the asset and search for the zones where statistical anomalies could occur, and that had some kind of alpha.
To be able to follow this article, it is necessary to have read the first three articles, which I leave the links for here below
 Jesús Cuesta
 Jesús Cuesta
 Jesús Cuesta
Action Plan
We are going to expand the functionality of the class, creating a function called optimize where, from an effective range of parameters such as
- Days of the week
- Entry Hour
- Entry Minute
- Bars Inside
We will traverse the entire assigned spectrum, and store the results in a dataframe, which we will later export to CSV, and will be the basis for finding statistical advantages within the asset.
For simplicity, we will not parallelize the processes; only a single process will be run concurrently. But the code can be accelerated without much complication, but the objective of this series is research, not the operational optimization of the processes.
Programming the field search
We are going to create a new function within the class, called optimize, which will perform the function of searching for alpha in a seasonal way within the asset. This field search consists of running a backtest for each of the parameters in the entered range, and storing the results.
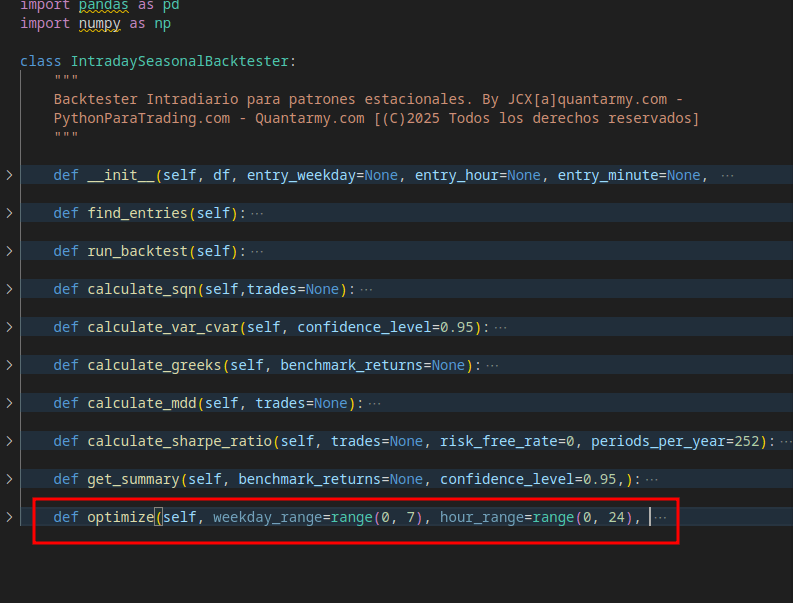
The class should look like this:
Defining the field search parameters
def optimize(self, weekday_range=range(0, 7), hour_range=range(0, 24), minute_range=range(0, 60), bars_range=range(1, 11), csv_path='optimization_results.csv'):
The parameters we will need to launch the function are:
- Weekday range: A numeric range of the days to be included in the optimization. The optimization filters by days, considering each day of the week as an independent case.
- Hour range: Hourly range that the search will run; it should be adjusted to the opening and closing hours of the asset to avoid wasting time with optimizations where the market is not trading, and consequently will give 0 results in all fields
- Minute range: This parameter is a fixed list of 0, 15, 30, 45 because our data is resampled in 15-minute intervals. But if working with higher or lower intervals, it should be readjusted.
- Bars Range: Refers to the range of candles the trade will be open. They are entered as a range because it will try all values in the range, making the exit longer or shorter, one by one. It is the simplest way to handle exits, and easily transformable to time.
Loading the necessary libraries
        from itertools import product
        from tqdm import tqdm

        all_results = []
The first step is to load the necessary libraries. In this case, through tqdm we will create a progress bar that visually shows us the state of the optimization; from the itertools.product function we will create all possible combinations from the entered parameters, to backtest one by one and save the results.
Similarly, we initialize a list called all_results, where we will save the parameters and most relevant ratios of the optimization.
        total_combinations = len(weekday_range) * len(hour_range) * len(minute_range) * len(bars_range)

        print(f"Iniciando optimización con {total_combinations} combinaciones...")
Subsequently we will calculate the total number of possible combinations, multiplying the length of the range by each of the parameters, and we show it before starting the field search so the user is aware of the difficulty of the task.
        parameter_combinations = product(weekday_range, hour_range, minute_range, bars_range)
        progress_bar = tqdm(parameter_combinations, total=total_combinations,
                            desc="Optimizando", unit="combinación")
Subsequently we will create all possible combinations between the arguments entered in the broad-spectrum search engine using itertools product, we define the progress bar, which will accompany the user throughout the optimization.
The product() function of the itertools module in Python is a powerful tool that generates the Cartesian product of the iterables we pass as arguments. In simple terms, it creates all possible combinations of the elements of the lists we provide.
Programming the broad-spectrum search
      for weekday, hour, minute, bars in progress_bar:
            backtester = IntradayBacktester(
                df=self.df.copy(),
                entry_weekday=weekday,
                entry_hour=hour,
                entry_minute=minute,
                bars_to_exit=bars)
            backtester.run_backtest()
            summary = backtester.get_summary()
The broad-spectrum search consists of, for each of the parameters in the entered ranges, we put them in a call to the IntradayBacktester backtester, run it, and save the summary. To subsequently
            result = {
                'entry_weekday': weekday if weekday is not None else 'All',
                'entry_hour': hour,
                'entry_minute': minute,
                'bars_to_exit': bars,
            }

            # Si hay trades, añadir todas las métricas
            if "message" not in summary:
                result.update(summary)  # Desempaquetar el diccionario summary
            else:
                # Si no hay trades, establecer valores predeterminados para todas las métricas
                for key in ['total_trades', 'winning_trades', 'losing_trades', 'win_rate',
                            'avg_profit', 'total_profit', 'max_profit', 'max_loss',
                            'variance', 'profit_factor', 'sharpe', 'sqn', 'mdd',
                            'VaR', 'CVaR', 'beta', 'alpha']:
                    result[key] = 0
                result['total_trades'] = 0

            # Añadir el resultado a la lista
            all_results.append(result)
Creates a 'result' dictionary with the basic input parameters (day of the week, hour, minute, and number of bars to exit) and then enriches it with performance metrics if trades have been made.
If there are no trades, it sets default zero values for all important metrics such as total number of trades, win rate, average profit, profit factor, Sharpe ratio, among others.
Finally, this complete result is added to an 'all_results' list, which will presumably be used for further analysis or to generate reports on the strategy's performance in different temporal scenarios.
Also, through the following code, if results have been produced, the progress bar is updated, to provide the user with feedback on what is happening behind the scenes
if result['total_trades'] > 0:
                progress_bar.set_postfix(trades=result['total_trades'], win_rate=f"{result['win_rate']:.2f}")
To Finish
Once all possible combinations have been backtested, we save the results in a dataframe, export the CSV, and show a print on screen, announcing that we have finished the search. This way results are only written once finished. For extremely long optimizations, or where the probability of error is higher, the CSV should be updated every N successful optimizations, or even every one, but for our work, it is more than enough.
        # Crear DataFrame con todos los resultados
        results_df = pd.DataFrame(all_results)

        # Guardar el DataFrame completo en CSV al final
        results_df.to_csv(csv_path, index=False)

        print(f"Optimización completada. Resultados guardados en {csv_path}")
        return results_df
Pseudocode
In case anyone hasn't understood very well what is intended, or wants to do it their own way, I also provide the pseudocode of the complete function
función optimize(weekday_range, hour_range, minute_range, bars_range, csv_path):
    inicializar lista all_results
    calcular total_combinations
    crear parameter_combinations usando product()
    crear barra de progreso

    para cada combinación de (weekday, hour, minute, bars) en parameter_combinations:
        crear nueva instancia de IntradayBacktester con parámetros actuales
        ejecutar backtest
        obtener resumen estadístico
        crear diccionario result con parámetros básicos

        si hay trades:
            añadir todas las métricas al diccionario result
        si no:
            establecer valores predeterminados para todas las métricas

        añadir result a all_results
        actualizar barra de progreso

    crear DataFrame results_df con all_results
    guardar results_df en CSV
    devolver results_df
Running from the Notebook
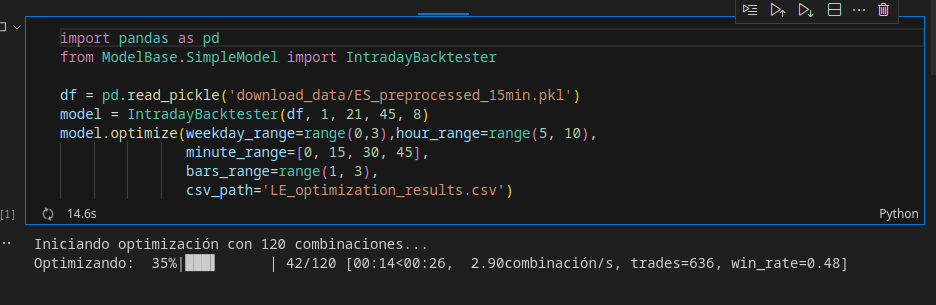
To run from a notebook or as any script, you only need to follow the following methodology
- Load the necessary libraries, in this case pandas and the IntradayBacktester
- Load the preprocessed dataframe to use
- Launch model.optimize with the adjusted ranges. In this case it will search from Monday to Wednesday, from 5 to 10 in minutes 15, 30, 45 and 00, and an exit window of 1 to 3 bars.
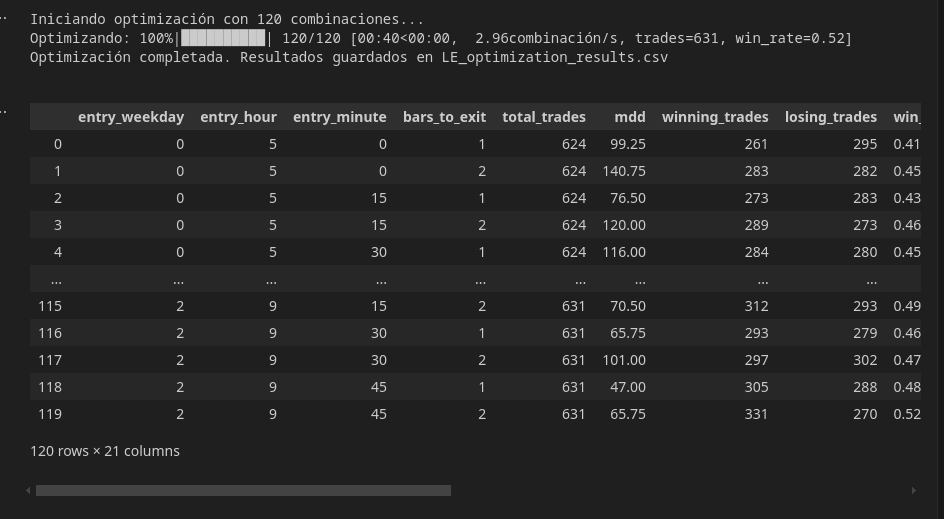
Once the optimization is executed, it will return the final dataframe, which could be assigned to a variable through
resultados = model.optimize(parametros)But it has been saved in a .csv, which we will later load. In this case the csv file corresponding to the optimization results is found in LE_optimization_results.csv
Conclusions
In this new article, we have seen how to get to the point of being able to search for seasonal advantages across the entire spectrum of the asset. In the next and last article, we will see how to interpret the optimization data in a simple way, through different plots, different statistics, etc.
If you missed any installment, the third article of the series covers the complete statistical analysis of the strategy.
See you in the next installment, for any questions, do not hesitate to contact me at jcx[a]quantarmy.com
Greetings, and until next time!