We are excited to announce the release of QAStats V3, the latest version of our quantitative statistics library. This release brings significant improvements and new features that make financial reporting and analysis easier than ever.
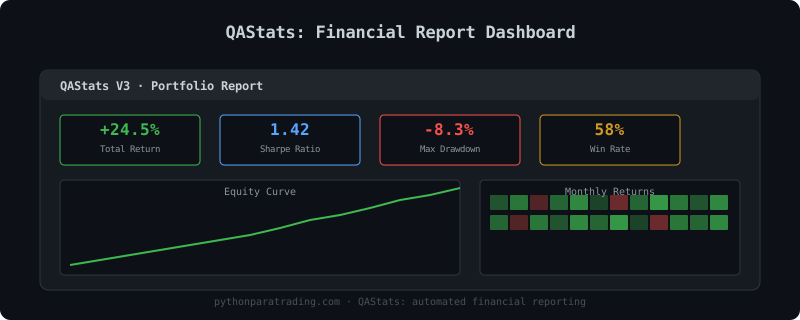
What's New in V3
- Improved performance: Faster calculations and report generation
- New metrics: Additional performance and risk ratios
- Better visualization: Enhanced charts and plots
- Modular architecture: Easier to extend and customize
- Python 3.12 support: Full compatibility with the latest Python versions
Key Features
QAStats V3 maintains all the features that made previous versions great, while adding new capabilities:
- Comprehensive performance reports
- Risk analysis metrics (Sharpe, Sortino, Calmar, etc.)
- Drawdown analysis
- Return distribution analysis
- Benchmark comparison
- Custom report generation
Installation
To install QAStats V3, simply use pip:
pip install qastats>=3.0.0Quick Start
Here's a quick example of how to use QAStats V3:
import qastats as qa
import pandas as pd

# Load your returns data
returns = pd.Series([...])  # Your returns data
benchmark = pd.Series([...])  # Benchmark returns

# Generate a full report
report = qa.create_report(returns, benchmark=benchmark)
report.show()
Advanced Statistics
import qastats
import pandas as pd
import numpy as np

data = pd.read_pickle('examples/daily_returns.pickle')
data['bench'] = np.random.normal(0.0001, 0.01, len(data))
stats = qastats.stats.get_daily_stats(data)
stats
dds = qastats.stats.get_drawdown_stats(data['Close'])
dds
qastats.stats.get_vami_daily(data['Close'])
qastats.reports.create_return_dd(data)
$$S_o = \frac{\mathbb{E}[R_p - R_f]}{\sigma_{\text{downside}}}$$
$$\text{MaxDD} = \min_t \left(\frac{V_t - \max_{s \leq t} V_s}{\max_{s \leq t} V_s}\right)$$
Repository
The QAStats V3 repository is available on GitHub:
 quantarmyz
$$S = \frac{\mathbb{E}[R_p - R_f]}{\sigma_p}$$
$$S_o = \frac{\mathbb{E}[R_p - R_f]}{\sigma_{\text{downside}}}$$
$$\text{MaxDD} = \min_t \left(\frac{V_t - \max_{s \leq t} V_s}{\max_{s \leq t} V_s}\right)$$
What's Next
We are already working on the next version, which will include even more features and improvements. Stay tuned for updates!