

After a long period completely disconnected, we return to writing some notes for you. On this occasion, we are going to program from scratch a complete research process, and instead of going for a specific asset, we are going to create a complete method, reusable in the future, to be able to run it against any asset.
The objective of this article is to create an algorithm that analyzes the intraday seasonal behavior of some product. Independently, we will not obtain any tradable advantage, but we will find the naked edge, a small statistical imbalance, which will serve as a basis for finding more robust advantages until we find a tradable strategy.
Personally, I have found quite a few naked edges that, with higher-level logic, have become algorithms that have been profitable for some period of time. Experience tells me that no algorithm is an infinite and immortal source of alpha. All advantages are born from imbalances that are corrected over time by the different market participants. And the objective of this tool is to be able to scan a specific asset, so that after its subsequent statistical validation processes, they can become another alpha in our portfolio.
This article has more parts available, you can access them at the following links
 Jesús Cuesta
 Jesús Cuesta
What is Intraday Seasonality.
We would define intraday seasonality as predictable and recurrent patterns in the behavior of prices, volatility, volume, and liquidity that occur during specific hours of the day.
Characteristics of Intraday Seasonality.
Intraday seasonality manifests as systematic patterns that repeat regularly at specific moments of the trading day. These patterns can be observed in:
- Price movements: Upward or downward trends that occur consistently at specific times of the day
- Volatility: U-shaped patterns where volatility is higher during market open and close, and lower during midday
- Trading volume: Predictable variations in commercial activity during certain hours
- Liquidity: Changes in bid/ask spreads at specific times
Causes of Intraday Seasonality
The factors causing intraday seasonality are higher levels of knowledge that we cannot define with total accuracy, but we can logically infer some of the factors that promote the appearance of these phenomena. Without speaking about a specific asset but about the effect in general, the most relevant patterns we could determine as the cause of this phenomenon would be
- Information Flow
- The scheduled publication of data that occurs at specific times, such as macroeconomic announcements, or of any other nature, that affect the natural behavior of the price.
- Market participant behavior
- Institutional investors who buy or sell systematically at certain times of the day, referring to both funds and natural consumers
- Differences between informed and uninformed trading
- Informed traders are institutional traders, who generally obtain better price conditions in their operations, showing more persistent behavior in their trading patterns, tend to act as initiators of market transactions in quality changes, and although they can hide all their volume, they do not necessarily try to hide in the order flow, as part of the literature suggests
- On the other hand, uninformed traders are associated with retail investors, who show high persistence with days of high uninformed volume followed by similar days, have aversion to trading when they anticipate the presence of informed traders, and adopt strategies in reaction to the high previous returns of the operations of informed participants. Much of these operations are trend-following operations, in reaction to the high returns of informed traders' operations.
- Inventory Risk
- One of the causes of intraday seasonality comes from market makers, who systematically adjust their inventories at specific times of the day, to avoid risks, creating an observable and exploitable pattern by uninformed participants. Assuming the risk that market makers release.
Analysis Requirements for Intraday Seasonality
To create our model that helps us identify these seasonal patterns, we will need
- High-quality data. Data is the raw material of research; the higher the data quality, the more extrapolable the advantages found will be. In this case, I will leave you a small fragment of historical data on a future, for all those who do not have a quality data provider
We are going to use a continuous future, calculated as the creation of synthetic and continuous price series by linking different individual futures contracts, which expire at different times, assigning predefined fixed rollover rules.
This process eliminates the jumps caused by contract expirations and provides a continuous and reliable historical price time series that is useful for backtesting strategies, modeling the movement of prices.
Although many analysts, when rolling the continuous future, opt for a rollover based on open interest or volume, we are going to work in the strictest way, which is a calendar-based rollover.
That is, contracts advance according to their expiration dates, ensuring the stability of the sequence based solely on the passage of time, and not on the trading of the asset.
It is the most appropriate way to find seasonality, since in advance we will know the contracts we will have in the future, even when they have no volume, or have not been created, eliminating part of the uncertainty in the model, and giving truthfulness to the series.
To download the data, go to the end of the article.
The data corresponds to the 6E future, from 2013 to 2023. With a 10-year history it is more than enough to perform this analysis, but to be able to carry out these analyses, I recommend you obtain a data provider that gives you updates and a variety of assets.
Project Structure
The project structure will have the following order
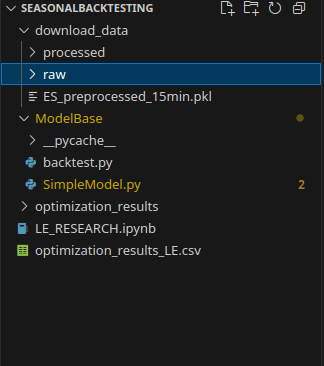
Where
- In the download_data folder, the raw (RAW) and processed data will be stored
- In the ModelBase folder, the search model and a quick backtest model will be stored
- In the optimization_results folder, the optimization results will be stored
And the rest of the files are completely dispensable
Data Preprocessing
The first step is to verify the data; the provider can make errors that are transferred to our model, consequently, they must be reviewed.
The data comes in a 1-minute timeframe. The optimal approach would be to build the candles from the trades executed in the top of the order book, but to simplify, we will obtain 1m trades. The dataframe we have is
import pandas as pd
data = pd.read_csv('download_data/6E_continuous.csv', index_col=0, parse_dates=True)
data.info()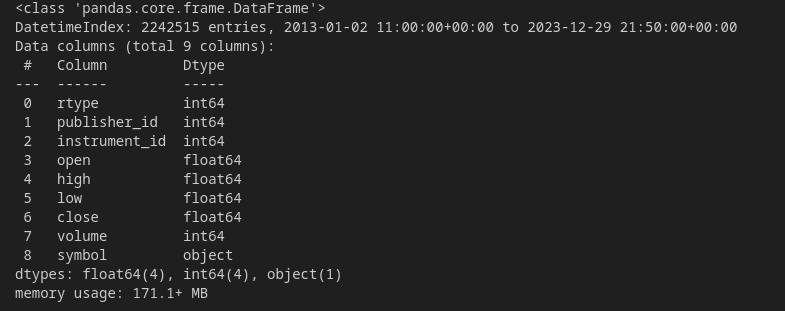
As we can see, there is a dataframe with 2,232,515 entries, from 2013 to 2023. Using 171MB of memory
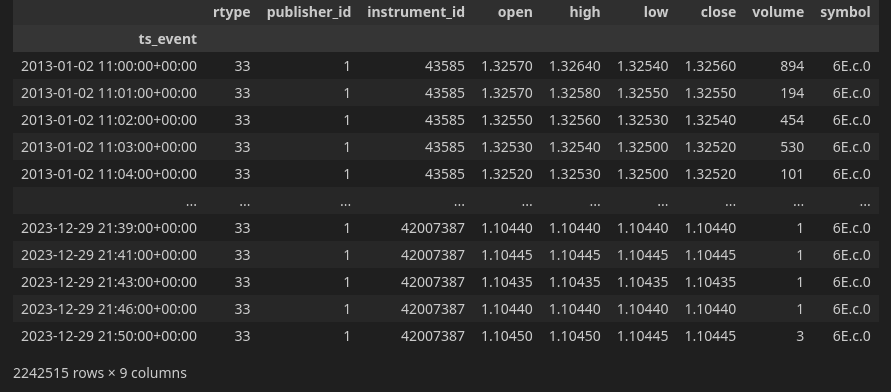
The dataframe is structured with the following columns, of which we will only describe the ones relevant to this purpose
- Instrument ID Refers to the ID of the instrument being handled within the continuous future calculation; it will change at each rollover
- open: The opening price of the candle
- high: The maximum price within the candle
- low: The minimum price within the candle
- close: The closing price of the candle
- volume: The volume of the candle
- symbol: The way to calculate the continuous future
Resampling the Data.
The first necessary step is resampling the data. By working with 1-minute data, it can be an excessive load without providing much extra information, consequently, we are going to transform them into 15-minute data. To do this, we will create a function that creates new 15-minute candles, using the 1-minute data we have. Grouping the values and using
- For the Open, the first value of the interval
- For the Close, the last value of the interval
- For the High, the highest value of the interval
- For the Low, the lowest value of the interval
- For the Volume, the sum of values across the entire interval
def resample_ohlcv(df, timeframe='15min'):
    """
    Resample 1-minute financial data to a larger timeframe.

    Parameters:
    -----------
    df : pandas.DataFrame
        DataFrame with OHLCV data. Index must be a DatetimeIndex.
    timeframe : str, default '15min'
        Pandas-compatible frequency string (e.g., '15min', '1h', '4h', '1d')

    Returns:
    --------
    pandas.DataFrame
        Resampled OHLCV data
    """
    # Asegurarse de que el df tiene un indice DateTimeIndex
    if not isinstance(df.index, pd.DatetimeIndex):
        raise ValueError("El DataFrame no tiene un indice apropiado.")

    # Define resample rules for OHLCV
    resampled = df.resample(timeframe).agg({
        'Open': 'first',     # First price in the period
        'High': 'max',       # Highest price in the period
        'Low': 'min',        # Lowest price in the period
        'Close': 'last',     # Last price in the period
        'Volume': 'sum'      # Sum of all volume in the period
    })

    return resampled
Now we are going to create a new function that performs data preprocessing, transforming the timeframe, and also creating new features that will help us later with the seasonal analysis.
These features are the day of the week, the hour, and the minute, accelerating the subsequent search for seasonal edges through the use of pandas masks.
def process(df):
    if not all(col in df.columns for col in ['open', 'high', 'low', 'close', 'volume']):
        print("Error: Missing required columns. Expected 'open', 'high', 'low', 'close', 'volume'")
        return None

    df = df[['open', 'high', 'low', 'close', 'volume']]
    df.columns = ['Open', 'High', 'Low', 'Close', 'Volume']

    data = resample_ohlcv(df, '15min')

    data['Weekday'] = data.index.weekday
    data['Hour'] = data.index.hour
    data['Minute'] = data.index.minute

    return data
To run the data preprocessing, we will do it as follows: we will load the CSV and send it to be preprocessed directly.
Once the DataFrame is processed, we should have a dataframe like this, which will be the raw material we will use to search for seasonal patterns
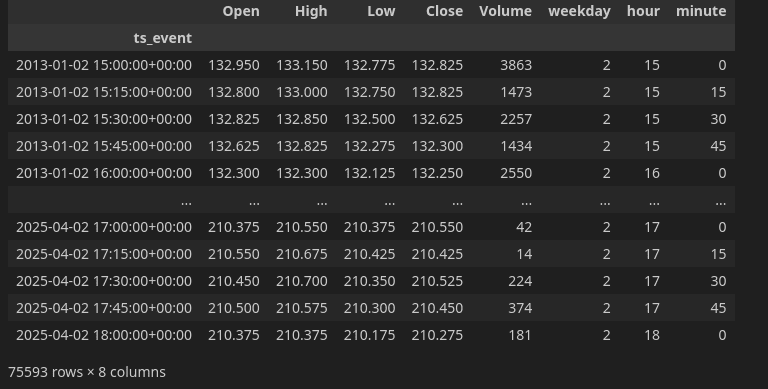
WARNING, this asset is not the same one you are using, but the columns should look the same; also make sure everything is correct by plotting the close.
Conclusions
In these notes, we have explained the concept of intraday seasonality, and we have prepared the data to be processed in a simple way; in the next installment, we will begin programming a class that, taking this dataframe as raw material, starts searching for seasonal patterns.
And if you want to advance faster, we have already published the third article of the series, where we detail the statistical analysis of intraday trading of the strategy.
Thank you all very much for sticking with us this far, and see you in the next installment.
Any questions, you can contact me at my email jcx[a]quantarmy.com. Greetings to all and see you in the next installment.
Continue the series
- Part III: Statistics on Trading
- Part II: Backtesting
- Part IV: Field Search
- Impact of Seasonal Factor on US Bonds
Resources
All resources are available only for members, register and access them!
Citations:
[1]
[2] [PDF] Forecasting intraday call arrivals using the seasonal moving ...
[3] Intraday Analysis: Techniques and Tips for Day Traders
[4] Data Sources And Preprocessing For Quantitative Trading
[5] Intraday Trading Analytics - QuestDB
[6] Complete overview of intraday trading analytics - QuestDB
[7] 13 Data Preparation Tools To Enhance Your Data Quality | Airbyte
[8] Intraday Trading Strategies - Backtests Analysis
[9] A Simple Way to Read Intraday Volume - Investopedia
[10] Using self-organizing maps to adjust for intra-day seasonality
[11] Preptimize: Automation of Time Series Data Preprocessing and ...
[12] Mastering Data Preparation: The Key to AI-Driven Trading Success
[13] 10 Best Intraday Trading Strategies for Stock Traders (With Examples)
[14] Exponentially weighted methods for forecasting intraday time series ...
[15] 5 Intraday Analysis Tips for Stock Market Traders - Timothy Sykes
[16] How to Choose the Best Tools for Data Preprocessing - LinkedIn
[17] Basic Guide to Trade Options Intraday: Strategies and Risk ...
[18] Intraday Seasonality and Volatility Pattern: An Explanation ... - SSRN
[19] Automating Intraday Strategies: From Manual Complexity ... - LinkedIn
[20] Clean, Transform, Optimize: The Power of Data Preprocessing
[21] Intraday Trading Strategies : r/algotrading - Reddit
Raw Futures Data
All the code programmed up to here.