Over time, some codes can start to see the light of day publicly, and reviewing old repositories, I found a very primitive version of a reporting library that made our lives much easier at the time.
For a while, within the team, there was no standardized workflow, and each person (with their mistakes) used different ways to solve models, with all the chaos that generated.
During an internal restructuring process, where I personally took charge of all internal processes for data management (datalakes) as well as the reporting part. We standardized the entire procedure, creating homogeneity in results, and eliminating many other problems.
All of this has advanced in a way that I would currently describe as high Swiss watchmaking technology, where it makes our day-to-day work easier. But at the time it was a real mess.
The released library is ready to work. However, it is recommended to understand its internal functioning, and for each person to adapt it to their needs. Through the foundations established in the library, it creates a solid work framework that can be customized to everyone's needs.
What is Financial Reporting
Financial Reporting is the discipline that translates the financial operations of an account, strategy, or any other subset, into a series of econometric values and visual interpretations that facilitate better understanding of the data.
The most commonly used libraries for financial reporting, on my part, have always been pyfolio-reloaded, a library that generates reports adapted to Zipline, basing ratio calculations on empyrical.
To have a standardized tool, where we could compare models and strategies, we started developing the library that we are releasing today.
Basic Necessary Functionalities
The main idea we wanted to convey was the 4 main concepts of pyfolio, adapted to our way of working, and which we now open for everyone.
- Solid reports, with robust statistics and calculations, all tested and validated, and most importantly, all reports comparable with each other.
- That they could be deployed together, or separately, in addition to giving the possibility to customize
- The way to ingest data is simplified to a percentage variation of an asset, and its benchmark, leaving aside individual trades, to use an end-of-day aggregate.
- That everything is modular, expandable, updatable, with easy maintenance
About QAstats
The library we currently use professionally does not differ much from the library released in this publication. The base is the same, only we have increased the functionality to fully adapt it to our needs and the needs of the compliance department.
The repo comes with an example to see its operation, but this library is created to be used as a base for future developments. Although it can be used as-is, the customization potential provided by the library's foundation is unlimited.
Link to QAstats Repository
 quantarmyz
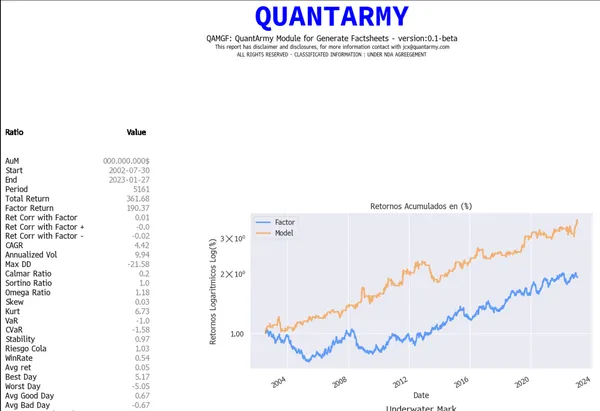
Example of a Report

Related posts: QAStats V3 Released · Introduction to Quant Research.