
In the complex field of economics and monetary policy, it is essential to have the ability to analyze and understand trends and the effects of economic policies. In this context, Python, a versatile programming language, has become indispensable for economists and financial analysts.
Python makes it possible to examine and model complex economic phenomena. In particular, the analysis of monetary policy, which focuses on the decisions and actions of central banks to control the money supply and regulate the financial system.
What Is the Federal Reserve?
The Federal Reserve, founded in 1913, is the central bank of the United States and plays an important role in economic stability. Its main function is to regulate and supervise the country's financial system. Through its monetary policy, it seeks to balance the economy, promote employment, and control inflation, which is a complicated task.
During the Great Depression and the 2008 financial crisis, the Federal Reserve made important decisions to stimulate economic activity and restore confidence in the banks. It also adjusts interest rates and takes measures to counter economic fluctuations.
The 2008 crisis was especially crucial, and the Federal Reserve made difficult decisions to stabilize financial markets and prevent an even greater economic collapse. Its collaboration with other central banks and stimulus programs were fundamental to the economic recovery.
In addition to its general impact on the economy, the Federal Reserve also influences people's saving and investment decisions. Its decisions on interest rates and access to credit shape individuals' short- and medium-term preferences.
Central Banks and Monetary Policy in Python
The mandate of the FED, its objectives are:
- Promote full employment.
- Maintain price stability.
- Regulate long-term interest rates.
First, the Federal Reserve seeks to promote full employment or a high rate of labor activity. This involves taking measures to stimulate economic growth and reduce unemployment. Through its monetary policies and tools such as altering interest rates, the Federal Reserve seeks to create a favorable environment.
Second, another key objective of the Federal Reserve is to maintain price stability. This involves keeping inflation under control and preventing drastic changes in price levels. The Federal Reserve seeks to avoid both runaway inflation and deflation, which can have negative effects on the economy. To achieve this objective, the Federal Reserve uses various tools and strategies, such as adjusting interest rates and regulating the supply of money in circulation.
Finally, the Federal Reserve is also concerned with moderating long-term interest rates. This involves influencing long-term interest rates to stimulate or slow down long-term investment and borrowing. By adjusting interest rates and monetary policy, the Federal Reserve seeks to influence the investment and borrowing decisions of businesses and consumers, thereby fostering stable and sustainable economic growth.
Monetary Policy
To achieve its objectives, the Federal Reserve uses monetary policy, its main tool. Monetary policy is implemented by the Federal Open Market Committee (FOMC), which is the body responsible for making decisions.
Changes in monetary policy are carried out through decisions that relate mainly to interest rates. Although we live in a market economy, the most significant price in the entire economy is the value of time, reflected in interest.
By its nature a transfer of risk, the mistakes made are reflected in the population in the form of inflation. Inflation, in turn, raises the cost of living across all social sectors.
Monetary policy decisions are mainly influenced by economic growth, inflation, and unemployment. These three indicators are considered the main measures of economic health.
When analyzing inflation, it is essential to use different indicators to understand the data. However, it is also crucial to think critically and consider whether the estimated data truly reflects reality. For example, when examining the consumer price index in Spain and inflation, we must ask ourselves whether the list of products used in the calculation accurately represents the population's consumption habits.
What Is the Money Supply?
The money supply is the term used to describe the total amount of money available in an economy. Money is characterized by being scarce and fungible, meaning it can be exchanged for goods and services. In the earliest stages of history, societies used various types of objects as a form of money, such as exotic shells or salt. As time progressed, money evolved in its physical form, eventually using precious metals as a medium of exchange. This evolution in the form of money reflects the need to find materials that were durable, universally accepted, and had a recognized intrinsic value.
The word "salary" originates from the Latin term "salarium," which referred to the remuneration or payment given to Roman soldiers in the form of salt. In ancient Rome, salt was a valuable and essential product, used to preserve food and as a condiment, so receiving a quantity of salt as part of payment was highly valued. Over time, the term "salarium" became generalized to refer to the monetary compensation given to a person in exchange for their work, and from this the word "salary" was derived in several languages, including Spanish.
The aforementioned changes generally occur after adjustments in the money supply, such as the introduction of new currencies or the development of seawater desalination technologies.
On the island of Yap, some of the earliest forms of money used in history are preserved to this day. They are gigantic stone disks, very heavy, and can measure up to 12 meters in height. Transporting these stones from distant places was a great challenge at the time. In Yap's culture, these stones had a special value and were used to carry out important transactions, such as buying land, paying dowries in marriages, or other large purchases.
The Yap stones had value because it was difficult to bring them from distant places to the island. Some people even died during transport. People trusted them as money because they were hard to obtain. But when easier forms of transportation appeared, people stopped believing in the value of the stones and stopped using them as money.
A more precise definition of money is any object or element that can be used to facilitate commercial exchanges efficiently.
It is now clear that the money supply refers to the totality of objects that can be exchanged for goods and services, representing the total value of the different types of money available.
After World War II, the United States emerged victorious and a new world order was established that had a great impact on trade and the future of humanity. In this new order, the US dollar became the accepted international currency and the only one that could be converted into gold. The United States took control of freedom and the global economy, and to this day it remains the undisputed leader.
What Is Inflation?
Inflation is the term used to describe a widespread increase in the prices of goods and services. This means that, in general, prices are rising and the value of money decreases over time.
In general, inflation is calculated by comparing percentage changes in prices over time. If prices rise, it is said that there is inflation. However, there is also deflation, which occurs when prices generally fall, meaning that buying something today can be more expensive than in the future. An example of deflation has occurred in the Japanese economy.
The causes of inflation are classified into three main categories:
One cause of inflation is when there is an increase in the demand for goods and services, known as "demand-pull inflation." This happens when consumers, businesses, or governments spend more, or when net exports increase. As a result, prices rise in general and all economic actors raise their prices to maintain their profits.
Another cause of inflation is "cost-push inflation." This occurs when the demand for goods and services decreases due to changes in consumer buying trends caused by external factors. For example, the price of a bottle of Coca-Cola that we used to buy for one euro can rise to ten euros due to runaway inflation. Although we still want to drink Coca-Cola, our decision to buy it is affected by the increase in costs.
In addition, inflation can be influenced by expectations of recession or other economic events that affect production costs and, therefore, prices in a widespread manner.
Price Instability
Fluctuations in currency prices can cause concern in international trade. To maintain a stable economy, it is crucial to have a currency that is not volatile, that is, one that remains stable. When the currency is volatile, it can lead to an increase in inflation. Companies have to protect themselves from the risks related to changes in the value of the currency, which leads to higher costs and, in turn, to price increases that affect customers.
Expectations
When inflation is expected in the future, all participants in the economy must make adjustments in their calculations and decisions. This is because they must take measures to protect themselves from the possible negative effects of inflation and minimize its impact.
Unofficial Causes
The reasons mentioned above take for granted that the economy is a static system, where millions of people can be reduced to a mathematical function that moves according to predefined criteria. This view does not consider the inherent complexity of any system, where multiple unpredictable factors and individual decisions intervene that can influence the course of events in a way that is often random.
In concrete reality, the economy is made up of millions of people pursuing their own individual goals. When they manage to achieve those goals, a widespread benefit is produced in society. In the last two decades, central banks have increased the amount of money in circulation.
How Is Inflation Calculated?
The calculation of inflation is done by comparing price changes using a specific formula. But it is necessary to keep in mind that the selection of products included in this calculation can be determined in a bureaucratic way, which may not reflect real changes in the prices of the economy. Sometimes this can be affected by political propaganda tactics.
What Is Unemployment?
Unemployment occurs when someone is looking for work but cannot find it. To measure and classify this situation, the population is divided into two groups: the labor force and the non-labor force. The labor force includes people who are actively seeking employment, while the non-labor group encompasses those who are not looking for work or are not available to work due to various reasons.
Calculating the labor force as:
$$
Labor Force = \frac{NactivePopulation}{N total population} * 100
$$
where:
$$Ny$$: The total number of individuals in the sample of category y.
Unemployment rate as:
$$
Unemployment Rate = \frac{N unemployed}{N activePopulation} * 100
$$
where:
$$Ny$$: The total number of individuals in the sample of category y.
During times of economic growth, when society progresses and uses more resources, there are generally fewer people out of work. This happens because more people need to be hired to create new products and services. In addition, in theory, wages tend to rise because there is more competition among employers who need to hire workers in a labor market with a similar number of available people.
The Federal Reserve uses the Phillips curve to estimate the base interest rate, to which it then applies factors to adapt it.
The Phillips Curve and NAIRU Equilibrium
The Federal Reserve is not obligated nor does it have the responsibility to carry out economic policies, although it strives to do so. However, sometimes a transfer of risk to taxpayers is observed, and policies that seem illogical are implemented, with the aim of creating favorable short-term economic perceptions for political reasons. An example of this is when the amount of money in circulation is increased and low interest rates are maintained, which can generate a significant risk of inflation. In addition, these measures discourage saving, promote excessive consumption, and can destabilize the economy as a whole, with unpredictable consequences in the short, medium, and long term.
Phillips shows that there is generally an inverse relationship between the unemployment rate and the inflation rate. However, it is important to keep in mind that this relationship is not constant and can be influenced by external factors. The economy is a complex system that cannot be completely captured by mathematical formulas. Therefore, the relationship between unemployment and inflation can vary at different times and in different situations.
A concept to consider in this context is NAIRU (Non-Accelerating Inflation Rate of Unemployment), which represents the unemployment rate at which the economy is in equilibrium and does not generate inflationary pressures. When unemployment is below the NAIRU, there tends to be an increase in inflation, since wages and prices tend to rise due to the scarcity of available workers.
Conversely, when unemployment exceeds the NAIRU, the economy has the capacity to absorb more employment without generating significant inflation.
It is essential to recognize that the concept of aggregate demand is a simplification of the complex and ever-changing economic reality. Despite its limitations, it is used as a reference point in decision-making by central banks, so it is necessary to use its notations and estimates to establish common goals. Adapting to these concepts helps us have a common framework in the economic decision-making process.
The Dual Mandate of Central Banks
The relationship between the Phillips curve and the Federal Reserve's dual mandate (Fed) is based on the need to find a balance between two main objectives: maintaining price stability and promoting full employment. The Fed's dual mandate involves the responsibility of maintaining low and stable inflation while seeking to achieve maximum sustainable employment.
Practice in Python
We proceed to create a basic model in Python to evaluate the Federal Reserve's policies over time.
To start, we will need to import the necessary libraries.
In this case, we will use "fredapi," a tool that allows us to access FRED. FRED is an official data repository of the Federal Reserve that offers open macroeconomic data series.
Here is the code to import the necessary libraries and establish the connection with FRED:
from fredapi import Fred
import pandas as pd
import numpy as np

fred = Fred(api_key='151cb28dcab*****6adcbe300e88')
To access FRED data, it is necessary to register at the following link and request an API key. Once we have the API key, we can proceed to download the data we need. In this case, we have selected the CPIAUCSL index, which represents the Consumer Price Index without removing products from the US basket. It is a central reference for estimating inflation and evaluating overall economic health.
We download the data through an API call.
data = pd.DataFrame(fred.get_series('CPIAUCSL'))
data.index[0]
Timestamp('1947-01-01 00:00:00')
The dataframe contains a large amount of data, since it spans from 1947 to the present. To begin, we will calculate the percentage changes of the index and then group them by year.
inflacion_pct = (data.pct_change())
inf_by_year = inflacion_pct.resample('Y').agg(sum) * 100
To analyze unemployment, we will use the official UNRATE data, which is published monthly by US agencies. These data have the same coverage as the inflation data, which provides us with the information needed for our analysis.
We will follow the same steps we used to analyze the inflation data.
data = pd.DataFrame(fred.get_series('UNRATE'))
paro_pct = (data.pct_change())
paro_by_year = paro_pct.resample('Y').agg(sum) * 100
Next, we will set some objectives for our analysis.
We will work within reasonable values. Although in a hypothetical and impossible scenario of perfect equilibrium, inflation would be 0% and unemployment would be 0%, in a more realistic and optimistic scenario for considering a country solid, in my opinion, it is an annual inflation of 2% and an unemployment rate of 5%. These will be the values we use in our model.
To start modeling all this information, it is necessary to standardize the units. It is important to keep in mind that a 10% change in unemployment does not have the same effect as a 10% change in inflation. Each has its own importance and impact on the economy.
target_inflacion = 2
target_paro = 5
Once we have the data and have established our positive and negative scenarios, it is time to perform the mathematical analysis of our information. This involves using statistical techniques and models to examine and draw conclusions from the available data.
Our Estimator
Since our goal is to create a simple model, we will use a ratio that consists of dividing the inflation rate by the unemployment rate. This ratio will give us a relative measure that combines both indicators and will help us understand the relationship between inflation and unemployment in our analysis.
(actual_data – fed_target) / sigma.
Translated into code:
sc_inf = ((inf_by_year - target_inflacion)/ inf_by_year.std())
sc_paro = ((paro_by_year - target_paro)/ paro_by_year.std())
With the purpose of simplifying a very complex reality, we are going to create an estimator based on the transformations of the different data. Our goal is to use a base formula that we will call the "Fed Ratio."
The formula for the "Fed Ratio" will be as follows:
|z_unemployment| + |z_inflation| * square root of -1 (as an imaginary number)
If we express this formula in code, it would look like this:
fed_ratio = scoring['z_paro'] + (scoring['z_inf'] * 1j)
As we can see in the descriptive statistics, the mean value of the variable is 1 standard deviation, with maximum moments of up to 6.
fed_ratio.describe()
| meta | z_norm |
|---|---|
| count | 76.000000 |
| mean | 1.104004 |
| std | 0.995912 |
| min | 0.164725 |
| 25% | 0.527178 |
| 50% | 0.731304 |
| 75% | 1.260911 |
| max | 6.142719 |
After analyzing the most relevant statistics, we can begin to formulate hypotheses about the data.
For example, we can examine what happened at the minimum point and for how long the variable remained within the average range. To simplify, we can establish that any value above 1.5 – 2 does not meet the objectives set by the Federal Reserve, which leads us to think that its performance has not been adequate.
Central Banks and Monetary Policy in Python
We understand that this simplification can be useful as a general approximation for understanding the macroeconomic landscape at a given moment in the market. Generally, the FED is expected to achieve its objectives, and it is uncommon for it not to do so or for unusual monetary policies to be implemented to prevent a widespread financial collapse. It is important to keep in mind that these measures can be considered temporary solutions to deeper problems and do not provide permanent solutions.
On the chart, we can represent the Fed Ratio estimator on a Cartesian plane, where the x-axis represents the deviation of the unemployment rate and the y-axis represents the deviation of the inflation rate. Each point on the chart would represent a specific year.
To highlight the interpretation, we can use different colors to distinguish the years in which the Fed Ratio is close to the point (0,0) and the years in which the Fed Ratio moves significantly away from that point. We can also consider using the size of the points based on the distance to the point (0,0), so that the furthest points have a larger size. In this way, the chart will allow us to clearly visualize the years in which the Fed Ratio is closest to the established objectives.
Remember that this is only a verbal description of what the chart could look like.
If you want to create the chart visually, I would recommend using data visualization tools with the Matplotlib library, which allow you to make these customizations and visualize the data more effectively.
fig, ax = plt.subplots()
plt.scatter(z_paro['1900':'2030'],z_inf['1900':'2030'])
plt.xlabel('PARO')
plt.ylabel('INFLACION')
ax.grid(True)
It is worth noting that this ratio can be used as an entropy indicator in macroeconomics, since high values indicate greater uncertainty relative to the established objectives.
When analyzing the data from 1960 onward, it is observed that the mean value of the ratio is close to the first standard deviation, which implies that the Fed's objectives have been largely achieved on average. It is essential to keep in mind that this model is a simplification of a complex reality, since the Fed's objectives can change in response to economic and political events, which makes the targets variable across different periods.
Two specific points stand out on the chart: the year 2015, where the ratio reaches a low point due to the FED's consideration of raising interest rates after a decade of monetary expansion, and the minimum value in November 2016, when the FED announces its second rate hike after the financial crisis, due to the strength of the labor market.
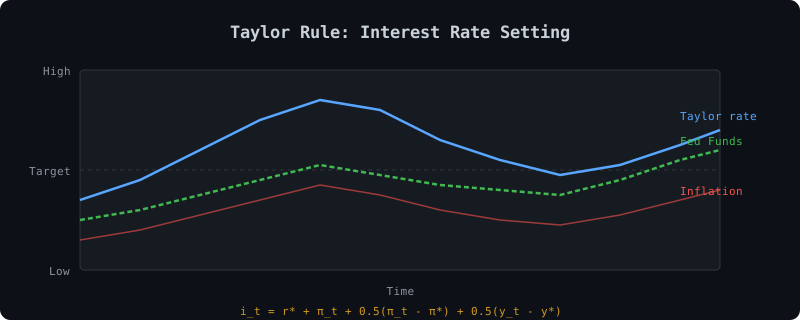
$$i_t = r^* + \pi_t + 0.5(\pi_t - \pi^*) + 0.5(y_t - \bar{y})$$
$$(1 + i) = (1 + r)(1 + \pi^e)$$
$$M = m \times B$$
Conclusions: Central Banks and Monetary Policy in Python
In conclusion, this article has comprehensively addressed the importance of central banks and monetary policy in Python. We have explored fundamental concepts such as the Federal Reserve, the money supply, inflation, unemployment, and the Phillips curve. In addition, we have analyzed the crucial role that central banks play in balancing the economy, highlighting their dual mandate of price stability and the promotion of employment.
Throughout the article, we have emphasized the need to understand monetary policy and its implications, since it has a direct impact on people's lives. From controlling inflation to managing unemployment, the decisions made by central banks can influence the economic well-being of a country.
Furthermore, we have demonstrated how Python, a programming language widely used in the financial and economic fields, can be a valuable tool for analyzing and modeling different aspects of monetary policy. By presenting a practical estimator, we have shown how it is possible to apply theoretical concepts in real scenarios using current technology and not esoteric lines of code.
Resources: